Etiopathogenesis of atopy
Increased risk of allostatic overload in personalities with sensory processing sensitivity – a contribution to the explanation of the etiopathogenesis of atopy and the most common mental disorders
The examinations with a screeningprocedure with 16 characteristics show an increased risk of the presence of atopic diseases, anxiety disorders, fatiguesyndrome anddepression in dependence on the level of sensory processing sensitivity.
Liffler P. (1), Treuherz S. (2), Fölster-Holst R. (3), Gieler U. (4), Peters E.M.J. (5)
(1) Children's Clinic Bellevue, 23769 Fehmarn OT Petersdorf
(2) Rehabilitation Centre Bad Nauheim, Wetterau Clinic
(3) University Hospital Schleswig-Holstein, Campus Kiel, Dermatology, Venereology and Allergology, Kiel
(4) Department of Dermatology and Allergology and Clinic for Psychosomatics and Psychotherapy, Psychosomatic Dermatology, Justus Liebig University, Giessen
(5) Department of Psychosomatics and Psychotherapy, Psychoneuroimmunology Laboratory, Justus Liebig University, Giessen
Correspondent:
Dr. med. Peter Liffler
Fasanenweg 19a
23769 Fehmarn
Phone:
+49 (0) 4372 - 8064296
Mobile:
+49 (0) 160 - 90918992
E-mail:
info@drpeterliffler.de
Short Title: Etiopathogenesis of atopy
Background:
The construct of sensory processing sensitivity describes a lower stimulus threshold, conspicuous emotional touchability and sensitivity to subtle stimuli. In a pilot study by Liffler, P. et al. (2019) [1], atopic-assessed adults differed from non-atopic-predisposed adults by these characteristics. A possible dependence of atopy on these personality traits is to be investigated.
Methods and patients:
An overall sample of adults (N=305) was divided into a group of persons with atopic diseases as well as a comparison group of non-atopic persons and investigated using the SENS-E screening method, a specific method for detecting sensory processing sensitivity.
Results:
The comparison of the atopic-assessed participants with the non-atopic participants confirmed the results of the pilot study. The Logistic Regression Analysis showed that the presence of atopic diseases increases significantly with the level of sensory processing sensitivity.
Discussion:
Sensory processing sensitivity is an irritant sensitivity that promotes a more pronounced stress response and increased susceptibility to stress-associated diseases and can thus also contribute to the explanation for the etiopathogenesis of atopy. The level of the SPS correlates with age, gender and occupation.
Key words:
Sensory processing sensitivity - diseases of the atopic circle of forms - odds ratio - etiopathogenesis.
1. Background
The "allergic diseases" are described as widespread diseases in the "White Paper on Allergy in Germany" and in a report by the Robert Koch Institute "becauseof the frequency of their occurrence and their high socio-economic importance for those affected and the healthsystem". The cause of the increase in allergic diseases is the Western lifestyle. In a historically unique field trial, the development of allergicdiseases in the two parts of Germany was compared. The surprising result: Despite an unhealthy diet and high airpollution in the industrial areas,The Germans in the East suffered only half as often from allergic diseases as the West Germans [2]. Wichmann then introduced the "Western lifestyle" into the scientific discourse and blamed it for the higher prevalence of asthma and allergies in Germany [3]. Under the "lifestyleconcept", all lifestylehabits typical of the West (e.B. Fast food, hygiene) and social factors suspected of being responsible for this development [4]. Environmental stimuli and psychological stress can adversely affect the course of an allergic disease. Howevewer, til today no stress factor has been proven that could be directly blamed for the accumulation of diseases of the atopic form. Even after earthquakes, for example, no increase in atopic dermatitis was recorded [5].
In everyday clinical practice, the doctors at the Bellevue Children's Hospital in Fehmarn noticed the conspicuous sensitivity, the supernaturally centric thinking and the overprotective parenting style of the parents of children with atopic dermatitis. This behavior was similar to the construct of Sensory Processing Sensitivity (SPS) introduced into scientific discourse by Aron & Aron in 1997 [6]. The construct was based on a more intensive and prolonged central nervous processing of internal and external stimuli. Characteristic features are emotional and physical sensitivity and the tendency to mental overstimulation [7]. In a pilot study [1], Liffler et al. investigated the association between SPS and atopy in 64 parents of children with atopic dermatitis. In the High Sensitivity Test (HS-Test), the German-language version of the Highly Sensitive Person – Scale, [8] parents who themselves suffered or had suffered from one of the atopic diseases differed significantly in 11 of the 27 items and in 3 tends to be significant. In the 3 personality tests, they differed only in three of the 24 scales. In the Gießen - test (GT) [9] there were no differences, in the Munich personality - test (MPT) [10] the atopics showed a lower frustration tolerance and a tendency to esoteric thinking and in the Freiburg personality inventory R (FPI-R) [11] an increased emotionality. In summary, there was a significant correlation between SPS and atopy. The authors assumed, that the increased sensitivity of parents should be considered as a co-factor for the development and maintenance of atopic dermatitis in their children. Due to the clinical significance, studies should be conducted with larger cohorts.
2. Methodology and patients
2.1 Objective of the investigation
The relationship between SPS and atopy should be checked. In addition, it should be clarified to what extent the atopic diseases correlate with the level of the SPS and which factors influence the level of the SPS.
2.2. Participant recruitment and ethicsvote
Between June and August 2019, 305 volunteer study participants were recruited through direct and onlinesurveys. Apart from age (> 18 years), there were no requirements or restrictions for participation in the study. Respondents were informed in writing about the objectives of the survey and the associated examination of a newly developed test for the evaluation of the SPS. Participation was voluntary and the questionnaire was answered anonymously. An ethics vote for the evaluation of the routinely collected data was not considered necessary either by the Ethics Committee of the Schleswig-Holstein Medical Association or the Ethics Committee of the Christian-Albrecht University, as the survey was carried out anonymously.
2.3. The sample description
The total sample (n= 305) was divided into two groups. In the study group (AP, n= 175), the participants were diagnosed with at least one of the atopic diseases (neurodermatitis, bronchial asthma, hayfever or allergies). In the comparison group (NAP, n= 130) such diseases were not reported.
The interference statistics of the two groups showed significant differences, as shown in Table 1.
Table 1: Description of the total sample (n=305) and the subsample of atopic persons (AP) and the comparative sample of non-atopic persons (NAP)

2.4. The test instrument
Empirically, the predisposition to sensory processing sensitivity is very variable. For the most part, the SPS is not recognizable to outsiders. Persons with a low to moderate SPS appear to outsiders more or less "thin-skinned",but not sick. For them, the HS - test is positive, but in personality-tests they usually appear inconspicuous. In personalities with high-grade SPS, the emotional and physical sensitivity as well as the uncertainty and easy excitability can hardly be overlooked. They always have high HS test results and abnormalities in personality tests. Lionetti et al. (2019), in a meta-analysis of 76 studies examining the SPS with "BigFive" personality-test, found significant results in personality test only in subjects with high HS test results. These personalities are hypersensitive to environmental stimuli and changes [12]. In terms of test psychology, therefore, the severity of emotional and physical sensitivity is primarily important. In Big Five personality-tests, this trait is only recognized when it leads to psychological abnormalities.
In the HS-test, half of the 27 features deal with indications of SPS. The other half describes non-specific characteristics, such as "I have a rich, multi-layered inner life" or "Iam a conscientious person", characteristics that are rarely confirmed by those affected in the HS test and that were not noticed in the personality -test as SPS-relevant. These characteristics and elaborate personality tests could therefore be dispensed with without the recording of the SPS suffering as a result. In order to rule out a personality disorder, personality tests should also be used in the case of greatly increased SPS.
From the results of the pilot study, therefore, the items were selected that had completely mapped the construct, achieved the highest selectivity and appeared clinically significant. Streamlining the toolbox and focusing on the characteristic feature of the SPS was essential for conducting studies with larger cohorts. The short method was used for the first time in the present study under the name SENS-E-Test. The significant features of the construct are depicted: emotional sensitivity (Item 1, 2, 4, 8, 9, 10, 11, 13, 14, 16); physical sensitivity (Item 3, 7, 9, 12); uncertainty and excitability (Item 5, 6, 15). The response format within a Likert scale of: never (0), possible (1), more common (2), mostly (3), always (4) gives a minimum score of 0 and a maximum score of 64. 30 points were chosen as the limit value of the screening procedure for simple differentiation inconspicuous vs. conspicuous. The sum of the mean values and standard deviations of the 16 items increases SPS totals, which enablea quick comparison of groups. In this form, the SENS-E test was suitable for fast and reliable detection of the SPS in cohort studies. The present study is part of the testing of the method.
2.5. Statistics
The statistical evaluations were carried out with the program IBM SPSS Version 24.0[1 3]. In the example description, test No. 2 was used and in the other comparisons the student t-Test was used for independent samples. It is tested whether the central tendencies of two independent samples are different. A logistic regression analysis was used to calculate the quota ratios.
3. Results
3.1. Comparison of AP and NAP with 16 points of the SENS-E procedure
When comparing the 175 AP with 130 NAPs, the former differed significantly in all points (Table 2). The internal consistency of the test was good.
Table 2: Comparative results of the 16 individual points of the SENS-E- screening procedure of AP vs. NAP

Notes: M = mean, SD = standard deviation, R = selectivity; Response format: never (0), possible (1), more common (2), mostly (3), always (4); statistically significant at the following levels: < 0,10; *≤ 0,05; **≤ 0,01; ***≤ 0,001, T-test.
3.2 The examination of the SPS-sum values in the study group and the comparison group and subsamples
In the following comparisons of SPS totals, the following significance values were applied: < .10; *≤.05; **≤.01; ≤,001.
3.2.1 Comparison of the SPS totals of the AP group (n=175) with the comparison group NAP (n=130)
The 175 AP (2,004 ± 0.663) differed significantly (p< 0,001) from the 130 NAP (1,631 ± 0,595).
3.2.2 The SPS-sum values of the most common diseases in the AP sub-stitchsample (n= 175)
The mental disorders showed significantly higher SPS values than the atopic diseases: exhaustion/burn-out (2.474 ± 0.675); anxiety disorders/phobias (2.428 ± 0.661); depressive moods (2.410 ± 0.629); atopic dermatitis (2.043 ± 0.654); rhinoconjunctivitis (2.041 ± 0.685); Bronchial asthma (1.916 ± 0.537).
3.2.3 The SPS-sum values of the AP and NAP subsamples with and without mental disorders
The SPS totals of the 71 AP with mental disorders (2.330 ± 0.601) differed equally significantly from those of the 104 AP without mental disorders (1.781 ± 0.611) (p<. 0, 001), how the total valuesof the 44 NAPs with mental disorders (1.927 ± 0.529) differed from those of the 86 NAPs without mental disorders (1.480 ± 0.572).
The SPS-sum-values of the 71 AP with mental disorders differed from those of the 44 NAPs with mental disorders just as significantly ***(P<0,001) as the sumvalues of the 104 APs without mental disorders from those of the 86 NAPs without mental disorders. The highest SPS values were observed in the 71 atopic participants with mental disorders and the lowest values for the 86 non-atopic patients without mental disorders (Table 3).
Table 3: The SPS totals of the AP and NAP subsamples with and without mental disorders.

Notes: M = mean, SD = standard deviation, response format: never (0), possible (1), more common (2), mostly (3), always (4); statistically significant at the following levels: < 0,10; *≤ 0,05; **≤ 0,01; ≤ 0,001, T-test.
3.2.4 The dependence of the SPS-sumvalues of the sub-sample AP (n=175) and NAP (n=130)
AP women (2.108 ± 0.666) differed significantly *** (p< 0.001)from NAP women(1.677 ± 0.601). AP men (1,674 ± 0.536), on the other hand, were not significantly different from NAP men.
AP women (2.108 ± 0.666) differed significantly from AP men (1,674 ± 0.536) *** (p<,001). NAP women (1.677 ± 0.601) were not significantly different from NAP men (1.553 ± 0.584).
3.2.5 The age dependency of SPS- sumvalues
In all age groups, AP found significantly or tendentially significantly higher PLC sum values than NAP. The values in both groups rose - at a lower level overall for NAPs - from the second decade (AP 1.871 ± 0.633; NAP 1.04 ± 0.433 p=.067) continuously (AP 2.274 ± 0.649, NAP 1.908 ± 0.785, p=,0,065) until the age peak in the fifth decade and thendeclined only slowly. In the 6th decade, AP and NAP differed significantly again with p= 0.002.
In all age groups, AP showed significant or a tendency towards significantly higher SPS totals than NAP (Table 4). AP's numbers rise from the second decade to the fifth-decade high of 2.274 ± 0.649 and then fall back to high levels. In the case of NAPs, however, the PLC values rose at a lower level up to the 5th level. Decade (1.908 ± 0.785). For AP and NAP, the age peak of THE PLC totals was in the fifth decade (Table 4).
Table 4: The age dependency of the SPS totals of AP and NAP in comparison.

Notes: M = mean, SD = standard deviation; Response format: never (0), possible (1), more common (2), mostly (3), always (4); statistically significant at the following levels: <.10; *≤.05; **≤.01; ≤.001, T-test.
3.2.6 Occupational group dependence of SPS-sum values
Atopic participants worked more frequently in the fields of art, culture, media and showed significantly higher PLC values in occupations with increased social contacts (art, culture, media, medicine, education, education, business, trade, banking) than in other occupations (Table 5).
Table 5: Occupational group dependence of SPS totals of atopic adults (AP) and non-atopic adults (NAP) compared to occupational dependence of SPS totals

Notes: N = number, M = mean, SD = standard deviation; Response format: never (0), possible (1), more common (2), mostly (3), always (4); statistically significant at the following levels: <.10; *≤.05; **≤.01; ≤,001, T-test.
3.2.7 The investigation of the SPS-sumvalues of diseases by means of logistic regression analysis
With the help of logistic regression analysis, the influence of a predictor on a binary criterion can be determined [14] as well as a quota ratio (OR; relative chance/chance ratio) [15]. Examination of the diseases showed that with the level of sensory processing sensitivity, the likelihood of the presence of certain diseases increases (Table 6). The rate of anxiety disorders was the highest.
Table 6: Logistic regression analysis: probability of occurrence of diseases of the atopic form and mental disorders as a result of SPS- stocks

Notes: Statistically significant at the following levels: *≤.05; **≤.01; ***≤.001
Conversely, the level of SPS was also influenced by the diseases. The calculations showed that only a maximum of 12% of the variance can be explained. The remaining 88% were influenced by other factors such as gender and age.
4. Discussion
The present study confirms not only the relationship between SPS and atopie shown by the pilotstudy, but also the connection with the most common mental disorders, such as anxiety disorders, depression and exhaustionsyndromes. Forty percent of the atopically predisposed subjects had reported such disordersn. High SPS values had already correlated with these disorders in previous studies [16-19]. The logistic regression analysis showed the influence of the SPS. The risk of the presence of atopic diseases and mental disorders depended significantly on the level of OR, with mental disorders showing significantly*** higher SPS and OR-levels than atopic disorders.
The dependence of the diseases on the level of the SPS could indicate that stress factors do not lead directly to the occurrence of stress-associated diseases, but through the individual processing and evaluation and reaction to the perceptions. This view has a long tradition in research: Selye, the discoverer of general adaptation syndrome, considered it possible that stress responses also develop without distress [23]. In the 1990s, it turned out that the concept of homeostasis does not sufficiently reflect the complexity of the human organism and its physiology. Sterling and Eyer first described the principle of allostasis in 1988. After this process, the body achieves lasting stability through its ability to control the systems involved (e.B. hypothalamo-pituitary secondary gland,cytokines, catecholamines) dynamically adapted to the changed requirements. They understood this as a process that constantly adapts to the conditions to be regulated. Only the insufficient or lack of adaptation to recurring stressors or the increased pace of changes led to the continuous stress (allostatic overload) of the organism and ultimately to the disease [24]. According to McEwen, this type of dysfunctional adaptation inevitably led to the accumulation of allostatic stress [25].
C. Strewe investigated the special stress-associated physiological systems (sympathoadrenerges and purinergesn system, endocannabinoid and glucocorticoid system) in humans in the context of long-lasting extreme situations. "When the brain perceives an event as exhausting and/or grueling, physiological responses and behavioral patterns are set in motion that lead to adaptation." Individual differences in stress perception, evaluation, recovery and management were revealed, which they rubbed against different genetic systems and different environmental influences. An important factor is also the duration of the demands to which individuals are exposed, as the allostatic load accumulates over time [26]. Gunnar and Quevedo also showed these individual differences in terms of perception of stress [28]. For Wittchen, the former director of the Institute of Clinical Psychology and Psychotherapy at TU Dresden, "the type of stress is less responsible for triggering the stress response than the individually different processing and evaluation process and the adaptation effort. Vulnerability (sensitivity or "thin-skinnedness") can lead to the occurrence of psychosis in combination with stressful life history processes, situational-social or physical-hormonal stress" [29].
The consequences of allostatic overload have been the subject of numerous investigations. Experimentally, the activation of the HPA axis by acute psychological stressors and social-evaluative situations could be proven [30 -33]. Of particular importance were social stressors, such as experiences of exclusion, experiences of belittling and situations associated with feelings of shame and humiliation. T. Seeman and E. Epel assumed that "the allostatic burden that accumulates over life" depends on the social situation, which can lead to "a socially dependent greater concern" for various diseases [34].
The sensory processing sensitivity corresponds to the principle of allostasis. Due to the more intense, longer and deeper stimulation processing, people with SPS recognize negative developments in the environment earlier and change their behavior. In the face of climate change and social divisions, for example, they recognise the need for cohesion and consideration earlier than others. In competitive societies, introversion and avoidance tendencies are seen as potentially maladaptive behavioural tendencies that can promote psychosocial stress. Therefore, due to the cumulative effects, strong and long-lasting maladaptations could more easily lead to fatigue, dysregulation and ultimately increased susceptibility to stress-associated diseases, such as chronic dermatitides or mental disorders, than in people with lower SPS.
The factors influencing the SPS were shown by the analysis of the sociobiographical data. There was a strong dependence of the SPS on gender. The higher SPS of the women correlated with the increased lifetimeprevalence for allergic diseasesn as well as with that for mental disorders. Allergic diseases occur in 37.9 % of women and 28.1 % of men [20]. 22.6 % of women suffered from anxiety disorders, but only 9.7 % of men. 16.4 % of women developed unipolar depression compared to 5.0 % of men [21].
In addition to gender, age affects the level of SPS. Atopic diseases also show a clear age dependency. Their prevalence increases continuously until the 4th decade of life. Fichter also noted a significant increase in mental disorders in the 45- to 65-year-old age group [22].
G. Gebauer has examined several thousand personalities with SPS and described their social and artistic talents and their inclination to corresponding activities [36]. Professions in the fields of art, culture, media, medicine and education place particularly high demands on employees, which in turn increase the risk of allostatic overload.
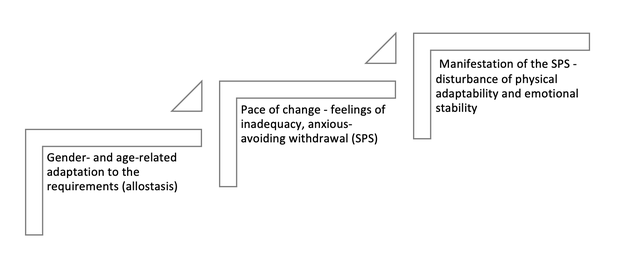
Figure 1: Increased risk of allostatic overload of personalities with sensory processing sensitivity
The present results thus contribute not only to the explanation of the equipathogenesis of atopy, but also to the most common mental disorders. The sensory processing sensitivity can be detected quickly and reliably with the help of the SENS-E - test. A risk profile of the patient can be derived from the height of the SPS. Very high SPS-sum values promote, for example, mental disorders such as fatigue syndromes, anxiety disorders and depression.
There were limitations with regard to the test instrument, which confirmed the results of the pilot study and revealed other plausible relationships, but is still in the testing phase. There were also restrictions with regard to the anonymous, non-reproducible information of the subjects in the biographical questionnaire. The cross-sectional design of the study also does not allow prospective statements. Due to the clinical importance of the atopically and stress-associated diseases should be tested in randomized controlled clinical trials (RCT) on large scales of stressassociated diseases.
5. Bibliography
1. Liffler P, Peters EMJ, Gieler U. Is there any evidence of the properties of sensory processing sensitivity (PLC) in atopically predisposed personalities? – A study on parents of children with neurodermatitis in inpatient treatment. Zeitschrift für Psychosomatische Medizin und ärztliche Psychotherapie 2019; 65: 14-26.
2. Hermann-Kunz E. Allergic Diseases in Germany Robert-Koch-Institut Bundesgesundheitsbl -Gesundheitsforsch - Gesundheitsschutz 2000 · 43:400–406 © Springer-Verlag 2000
3. Wichmann HE. Possible explanation for the different trends of asthma and allergy in East and West Germany. Clinical & Experimental Allergy 1996; 26(6):621-623.
4. Elvers HD. Living situation, environment and health. The influence of social factors on the development of allergies. Deutscher Universitäts-Verlag 2005. Wiesbaden. S 20-25.
5. Dalgard, F.J., Gieler, U., Tomas-Aragones, L., Lien, L., Poot, F., Jemec, G.B., Misery, L., Szabo, C., Linder, D., Sampogna, F., Evers, A.W., Halvorsen, J.A., Balieva, F., Szepietowski, J., Romanov, D., Marron, S.E., Altunay, I.K., Finlay, A.Y., Salek, S.S., Kupfer, J. (2015): The psychological burden of skin diseases: a cross-sectional multicenter study among dermatological out-patients in 13 European countries. J. Investig. Dermatol. 135, 984-991.
6. Aron EN, Aron A. Sensory-Processing Sensitivity and its relationship to introversion and emotionality. Journal of Personality and Social Psychology 1997; 73: 345-368.
7. Aron E, Aron A. and Jagiellowicz J. Sensory Processing Sensitivity: A Review of the Development of Biological Responsiveness. Personality and Social Psychology Review 2012; 16: 262-282.
8. Aron E.N. (1996) Counseling thehighly sensitive person. Counseling and Human Development 28, 1-7
9. Beckmann D, Brähler E, Richter HE. Der Gießener Test (GT), Manual. Göttingen/Bern: Huber, 1991.
10. Zerssen von D, Petermann F. München Personality test: MPT; manual. Göttingen: Hogrefe, 2012.
11. Fahrenberg J, Hampel R,
12. Lionetti F, Pastore M, Moscardiono U, Norentini A, Pluess K, Pluess M. . Sensory Processing Sensitivity and its Association with Personality Traits and Affect: A Meta-Analysis Journal of Research in Personality 2019; 81:138 – 152.
13. SPSS 24.0 IBM Germany, Böblingen 2017.
14. Agresti A. An Introduction to Categorical Data Analysis (2nd ed.) New York: Wiley; 2018.
15. Döring N, Bortz J. Research Methods and Evaluation in the Social and Human Sciences (5th edition), Springer, Berlin Heidelberg 2016.
16. Neal JA, Edelmann RJ, Glachan M. Behavioral inhibition and symptoms of anxiety and depression: Is there a specific relationship to social phobia? British Journal of Clinical Psychology 2002; 41: 361-374
17. Liss M, Timmel L, Baxley K, Killingsworth P. Sensory processing sensitivity and their relationship to parental attachment, anxiety, and depression. Personality and individual differences 2005; 39: 1429-1439.
18. Liss M, Mailloux J, Erchull MJ. The relationship between sensory processing sensitivity, alexithymia, autism, depression and anxiety. Personality and individual differences 2008; 45: 255-259.
19. Meyer B, Ajchenbrenner M, Bowles DP. Sensory sensitivity, attachment experiences and rejections in adults with borderline and avoidable features. Journal of Personality Disorders 2005; 19: 641-658
20. Langen U, Schmitz R, Steppuhn H. Prevalence of allergic diseases in Germany. Institute of Epidemiology and Health Surveillance, Robert Koch Institute, Bundesgesundheitsanzeiger 2013; 56:698-706, DOI 10.1007/ s00103-012-1652-7, published online: May 27, 2013.
21. Jacobi F, Höfler M, Strehle J, Mack S, Gerschler A, Scholl L, Busch MA, Hapke U, Gaebel W, Maier W, Wagner M. Zielasek J, Wittchen HU. Mental disorders in the general population. The Neurologist 2014; 85(1), 77-87.
22. Fichter M. Geschichte psychischer Erkrankungen in der Bevölkerung, Springer-Verlag Berlin Heidelberg 1990.
23. Gebauer G. High sensitivity: survey result and test. https://hochsensible.eu/sample-page/, accessed August 28, 2017
24. Selye H. Stress without need. Psychopathology of human adaptation. Springer, Boston, 1976.
25. Sterling P, Eyer J. Allostasis: a new paradigm to explain excitation-pathic pathology. In: S. Fisher, J. Reason (eds.) Handbook of life stress, cognition and health, Wiley & Sons, New York; 1988. pp. 631-651.
26. McEwen BS, Stellar E. Stress and the Individual. Mechanisms that lead to diseases. Archive of Internal Medicine. 1993; 153: 2093-2101.
27. Strewe, C. Regulation of human allostasis by sympathoadrenergic, glucocorticoid, purinergic and endocannabinoid systems under norm influence and hypoblytic hypoxia and simulated weightlessness. diss. Imu, 2019, Clinic of the University of Munich; 3 – 5.
28. Strewe, C. Regulation of human allostasis by sympathoadrenergic, glucocorticoid, purinergic and endocannabinoid systems under norm influence and hypoblytic hypoxia and simulated weightlessness. diss. Imu, 2019, Clinic of the University of Munich; 3 – 5.
29. Gunnar M. The neurobiology of stress and development. Annual review of psychology. 2007; 58: 145-173.
30. Wittchen HU, Hoyer J. What is Clinical Psychology? Definitions, concepts and models. In Wittchen HU, Hoyer J: Clinical Psychology & Psychotherapy. 2nd edition. Munich: Springer, 2011; 21-23.
31. Kirschbaum C, Pirke KM, Hellhammer DH. The "Triersocial Stress Test" – a tool for investigating psychobiological stress reactions in the laboratory. Neuropsychobiology 1993; 28: 76-81
32. Dickerson SS, Kemeny ME. Acute stressors and cortisol reactions: a theoretical integration and synthesis of laboratory research. Psychological Bulletin 2004; 130: 355-391. doi:10.1037/0033-2909.130.3.355.
33. Marmot MG. Status Syndrome: How your social standing directly affects our health and longevity. Paperback ed., transferred to digital print 2009 ed., Bloomsbury, London, 2004. ISBN 0-7475-7408-1.
34. Sapolsky M. The influence of social hierarchy on primate health. Science 2005; 308: 648-652. doi:10.1126/science.1106477.
35. Seeman T, Epel E, Gruenewald T, Karlamangla A, McEwen BS. Socioeconomic differences in peripheral biology: cumulative allostatic stress. Ann N Y Acad Sci. 2010; 1186: 223-239. NYAS5341 [pii] doi:10.1111/j.1749-6632.2009.05341.x
36. Gebauer G. High sensitivity: survey result and test. https://hochsensible.eu/sample-page/, accessed August 28, 2017
Kontakt
Dr. Peter Liffler
Fasanenweg 19a
23769 Fehmarn OT Petersdorf
Email: info@drpeterliffler.de
Tel.: +49 (0) 160 90 91 89 92


